6.3 KiB
Integrate with Monasca
This section shows a step-by-step guide for integration MoNanas with Monasca.
Alarm management
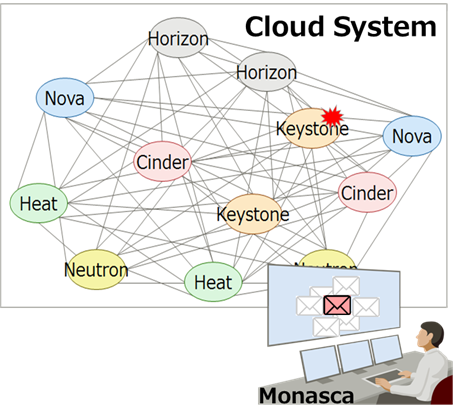
For example, let's say you have a some cloud system built on OpenStack, and all services have been monitored by Monasca.
Operators got tons of alarms when a trouble happened even if there is actual trouble in one service.
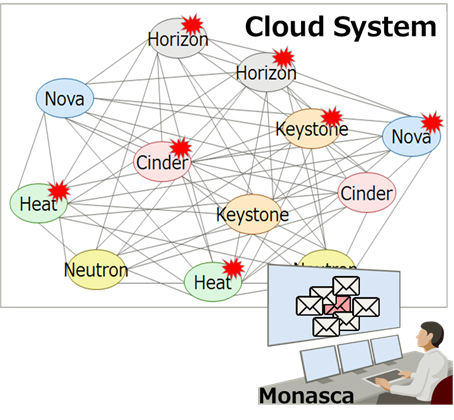
Integrating MoNanas and Monasca eliminates unnecessary alarms. And save the operator from long investigation works!
Running the MoNanas
To manage alarms from Monasca, perform the following steps.
Alarm Definition in Monasca.
Refer to Monanas API.
Configuration File in MoNanas
Before running MoNanas, we need to create a configuration file describing how we want MoNanas to orchestrate the data execution (creating a pipeline).
You can edit configuration in $MONANAS_HOME/config/markov_source_config.json like the following.
{
    "spark_config": {
        "appName": "testApp",
        "streaming": {
            "batch_interval": 1
        }
    },
    "server": {
        "port": 3000,
        "debug": false
    },
    "sources": {
        "src1": {
            "module": "TextFileSource",
            "params": {
                "dir": "/tmp/source_data"
            },
            "features": [
                         "api_response.time.5sec.cinder1",
                         "api_response.time.5sec.cinder2",
                         "api_response.time.5sec.heat1",
                         "api_response.time.5sec.heat2",
                         "api_response.time.5sec.keystone1",
                         "api_response.time.5sec.keystone2",
                         "api_response.time.5sec.neutron1",
                         "api_response.time.5sec.neutron2",
                         "api_response.time.5sec.nova1",
                         "api_response.time.5sec.nova2"
                        ]
        }
    },
    "ingestors": {
        "ing1": {
            "module": "CloudIngestor"
        }
    },
    "smls": {
        "sml1": {
            "module": "LiNGAM",
            "threshold": 0.5
        }
    },
    "voters": {
        "vot1": {
            "module": "PickIndexVoter",
            "index": 0
        }
    },
    "sinks": {
        "snk1": {
            "module": "FileSink2",
            "params": {
                "dir": "/var/tmp/result/markov",
                "file_prefix": "result"
            }
        },
        "snk2": {
            "module": "StdoutSink"
        }
    },
    "ldps": {
        "ldp1": {
            "module": "CloudCausalityLDP"
        }
    },
    "connections": {
        "src1": ["ing1", "ldp1"],
        "sml1": ["vot1"],
        "ing1": [],
        "vot1": ["ldp1"],
        "ldp1": ["snk1"],
        "snk1": [],
        "snk2": []
    },
    "feedback": {}
}
The flow of data execution is defined in connections. In this case, data
are ingested from src1. The data are then ingested by ing1 where
each entry is converted into a format suitable for machine learning algorithm.
MoNanas uses numpy.array as a standard format. Typically, an aggregator is
responsible for aggregating data from different ingestors but in this scenario,
there is only one ingestor, hence the implicit aggregator (not defined in the
configuration) simply forwards the data to sml1, which simply deduplicates
the data then uses LiNGAM algorithm to find a causality structure of the
aggregated data then passes the result (structure) to vot1. The voter is
configured to pick the output of the first SML function and forwards that to
ldp1. Here, the live data processor transforms data streamed from src1
using the causality structure and pushes it to standard output as well as the
specified Kafka server.
Run MoNanas
As the sink of this orchestration is Kafka, we need to run Apache Zookeeper and Apache Kafka first.
$KAFKA_HOME/bin/zookeeper-server-start.sh \
  $KAFKA_HOME/config/zookeeper.properties

$KAFKA_HOME/bin/kafka-server-start.sh \
  $KAFKA_HOME/config/server.properties
After that, start MoNanas as follows.
python $MONANAS_HOME/run.py -p $SPARK_HOME -c $MONANAS_HOME/config/markov_source_config.json \
  -l $MONANAS_HOME/config/logging.json
A default logging configuration file is located in $MONANAS_HOME/config.
Users can override this option. Currently, -l option is mandatory as MoNanas
does not assume a default configuration.
Start Data Execution
MoNanas exposes REST API for controlling the data execution. Use any HTTP client to POST with the following request body to MoNanas server to start data streaming.
{
  "action": "start_streaming"
}
e.g. using curl from terminal to make a request assuming the server is running locally.
curl -H "Content-Type: application/json" -X POST \
  -d '{"action": "start_streaming"}' \
  http://localhost:3000/api/v1/actions
Results
The sinks for the transformed (processed) alerts defined in the configuration
are via standard output and Kafka server. Therefore, the output will be
displayed in the console. Alternatively, users can subscribe to a queue
with the topic transformed_alerts using any Kafka client. A result example
(live data processing with aggregation mode based on causality structure) found
by LiNGAM algorithm is shown below.
{
    "alarm": {
        "state": "ALARM",
        "alarm_definition": {
            "name": "api_response.time.5sec.nova2"
        }
    },
    "__monanas__":
        [
            {
                "causes": [
                    "api_response.time.5sec.neutron2",
                    "api_response.time.5sec.cinder1",
                    "api_response.time.5sec.nova1",
                    "api_response.time.5sec.keystone1",
                    "api_response.time.5sec.keystone2"
                ]
            },
            {
                "results": [
                    "api_response.time.5sec.cinder2",
                    "api_response.time.5sec.heat1",
                    "api_response.time.5sec.heat2",
                    "api_response.time.5sec.nova1",
                    "api_response.time.5sec.neutron1",
                    "api_response.time.5sec.keystone1"
                 ]
            }
        ]
}