13 KiB
HA InfluxDB as an external storage for Prometheus
- Abstract
This document describes a way to provide high-available InfluxDB storage based on Influx-relay and Nginx.
Prometheus storage issue and solutions
Prometheus native storage was designed only for short period data and needs to be shortened in order to stay responsible and operational. For us to store persistent data for longer periods the 'external storage' mechanism was used. In this mode Prometheus duplicating its own data to external storage, only external writes are available. Several options were possible but we chose InfluxDB high-available solution. InfluxDB is a reliable and robust storage with many features. Also, it's perfect in supplying monitoring data to Grafana dashboard.
| Software | Version |
| Prometheus | 1.4.0 |
| Grafana | 4.0.1 |
InfluxDB installation overview
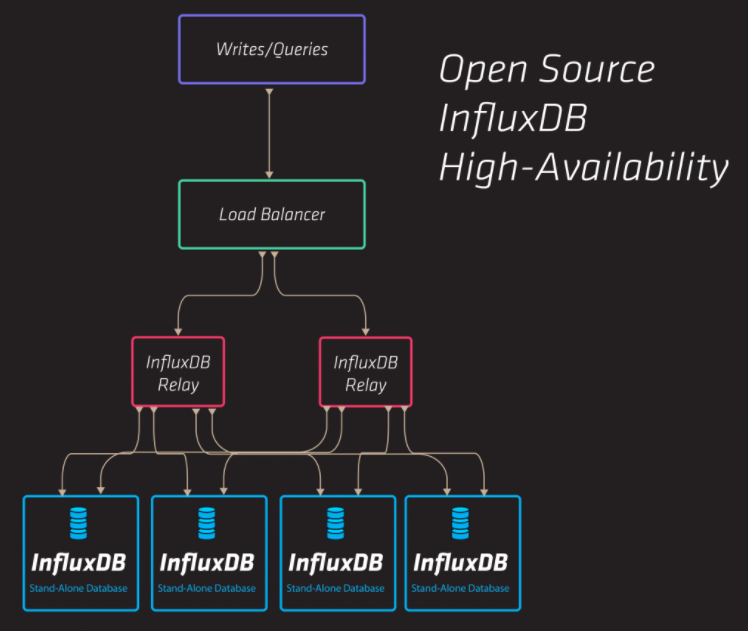
During our deployment we were following Influx-Relay Offical Documentation. The installation comprises three nodes: - first and second are InfluxDB instances with running Influx-relay daemon - third is a load-balancer node with running Nginx
Influx-Relay working scheme taken from InfluxDB web site describes 5-nodes installation (four InfluxDB instances + Loadbalancer node), but three nodes were sufficient for our working load.
Ubuntu Xenial were used on each node. See software version table below:
| Software | Version |
| Ubuntu | Ubuntu 16.04.1 LTS |
| Kernel | 4.4.0-47-generic |
| InfluxDB | 1.2.0-17 |
| Influx-Relay | adaa2ea7bf97af592884fcfa57df1a2a77adb571 |
| Nginx | nginx/1.10.0 (Ubuntu) |
In order to deploy InfluxDB HA deployment InfluxdbHA deployment script was used.
InfluxDB HA mechanism realization
Native HA mechanisms were moved away from InfluxDB (since version 1.x.x) and now provided only as an enterprise option. Open-source third-party software Influx-relay is considered as one of the available substitutions for previous native replication mechanisms.
Influx-Relay
Influx-relay is written in Golang and its operation boils down to proxying incoming write queries to multiple destinations (InfluxDB instances). Influx-Relay runs on every InfluxDB node, thus any writes requests coming to any InfluxDB instance are mirrored across all other nodes. Influx-Relay is light and robust and it doesn't consume much of the system resources. See Influx-Relay configuration in the Influx-Relay configuration section.
Nginx
Nginx daemon runs on a separate node and acts as load-balancer (upstream proxy mode). It redirects '/query' queries directly to an each InfluxDB instance and '/write' queries to an each Influx-relay daemon. Round-robin algorithm is scheduled for both query and write. This way, incoming reads and writes are balanced equally across the whole InfluxDB cluster. See Nginx configuration in the Nginx configuration section.
InfluxDB Monitoring
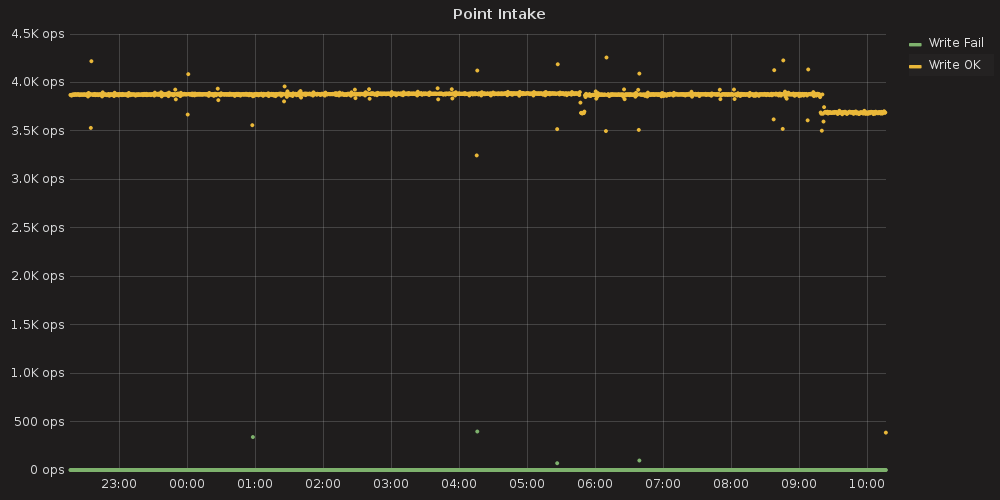
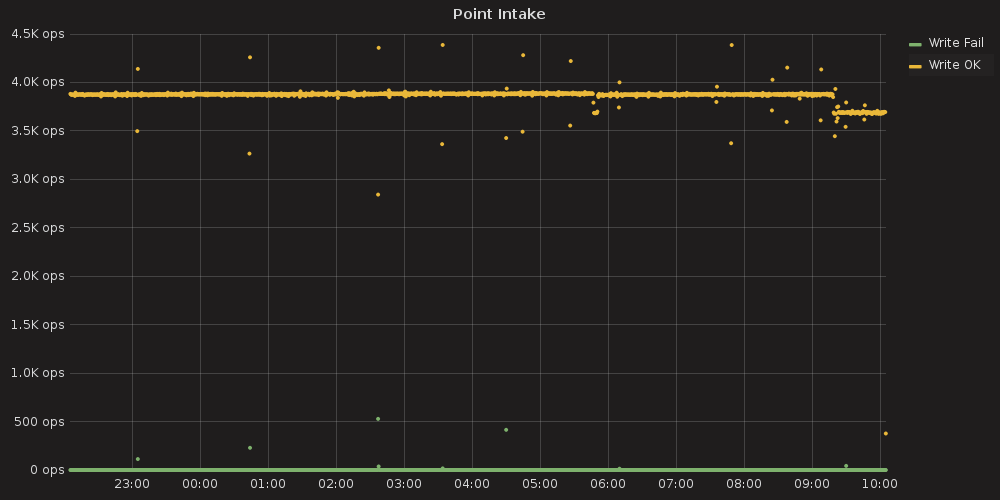
InfluxDB HA installation was tested with Prometheus that polls 200-nodes environment and generates huge data flows towards its external storage. In order to test InfluxDB performance '_internal' database counters were used and visualized with the help of Grafana. We figured out that 3-nodes InfluxDB HA installation can handle 200-nodes Prometheus load and total performance doesn't degrade. Grafana dashboards for InfluxDB monitoring can be found at Grafana InfluxDB dashboard section.
InfluxDB HA performance data
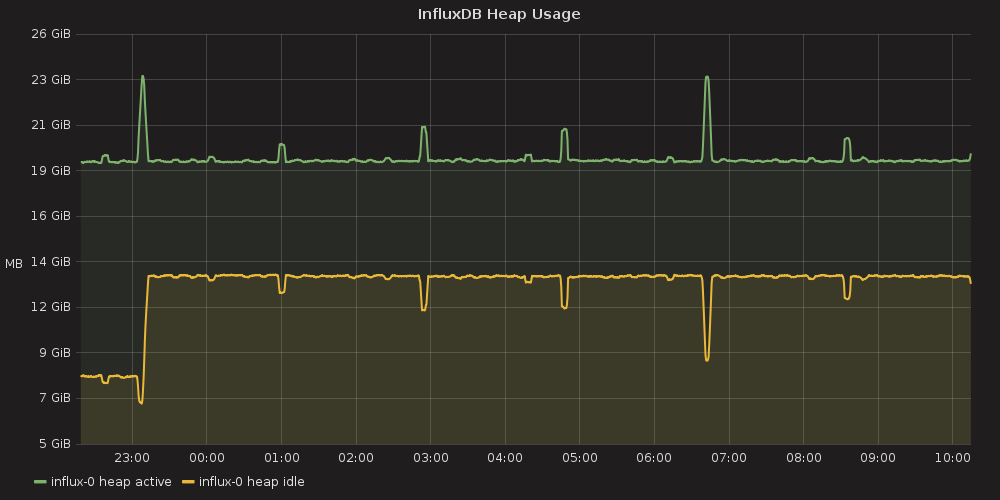
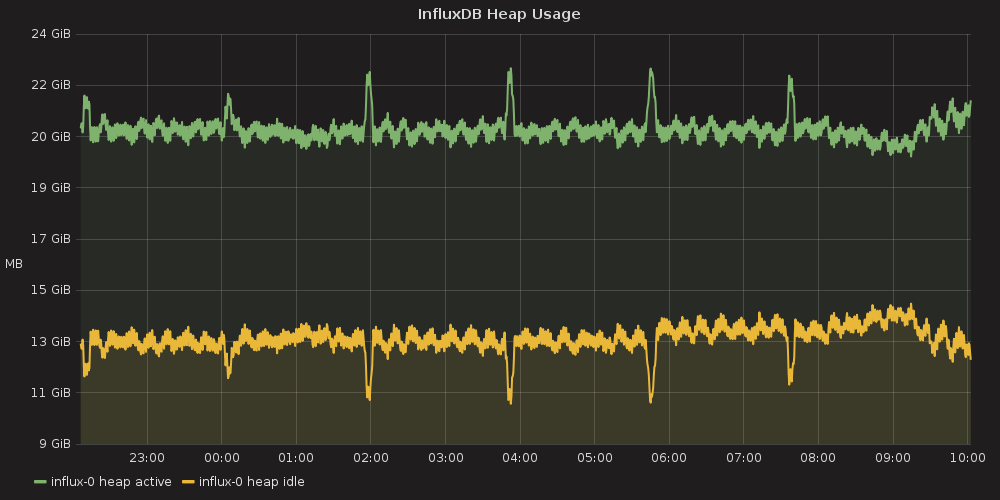
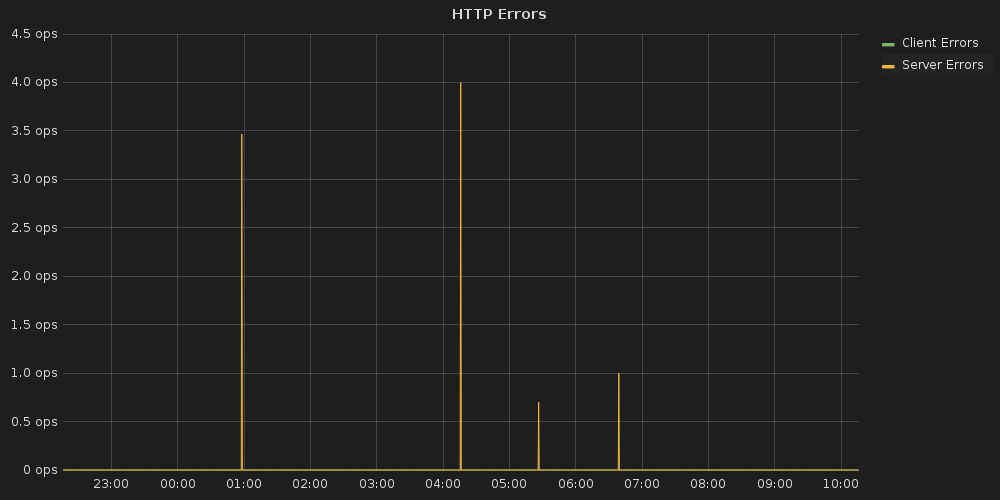
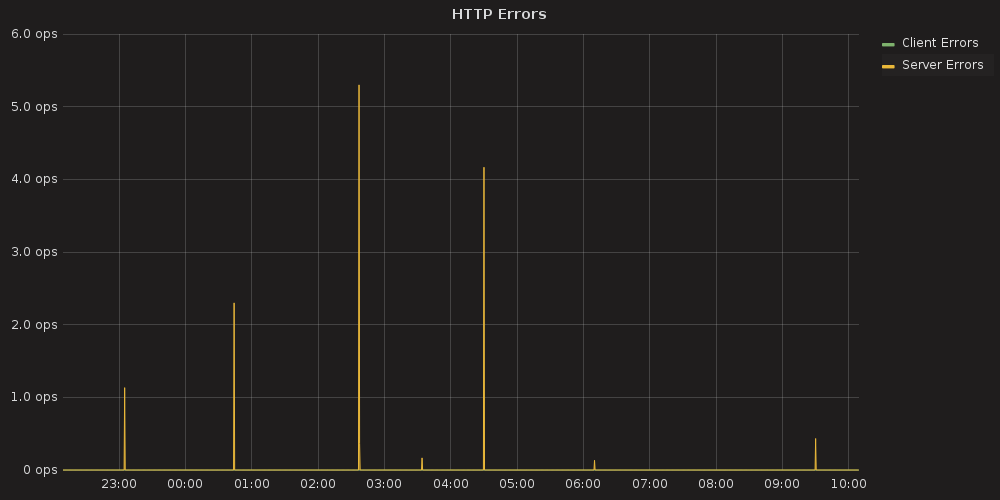
InfluxDB database performance data
These graphs were built with Grafana based on the metrics that are natively stored inside the InfluxDB '_internal' database. To create the visualization we used Grafana InfluxDB dashboard.
| InfluxDB node1 database performance | InfluxDB node2 database performance |
|---|---|
 |
 |
 |
 |
 |
 |
OS performance data
Operation System performance metrics were gathered using Telegraf agent that was started on each cluster node with appropriate plugins. See the Telegraf system configuration file from Containerized Openstack Monitoring documentation.
InfluxDB node1 OS performance
 |
 |
 |
 |
InfluxDB node2 OS performance
 |
 |
 |
 |
Load-balancer node OS performance
 |
 |
 |
 |
How to deploy
- Prepare three Ubuntu Xenial nodes with working network and Internet access
- Temporarily allow ssh access for root user
- Untar influx_ha_deployment.tar
- Set appropriate SSH_PASSWORD variable in the influx_ha/deploy_influx_ha.sh
- Start deployment script preceding it with node ip variables, e.g.
INFLUX1=172.20.9.29 INFLUX2=172.20.9.19 BALANCER=172.20.9.27 bash -xe influx_ha/deploy_influx_ha.shApplications
InfluxdbHA deployment script
influx_ha/deploy_influx_ha.sh
Configuration tarball (for deployment script)
influx_ha_deployment.tar <influx_ha/influx_ha_deployment.tar>
InfluxDB configuration
influx_ha/conf/influxdb.conf
Influx-Relay configuration
first instance
influx_ha/conf/relay_1.toml
second instance
influx_ha/conf/relay_2.toml
Nginx configuration
influx_ha/conf/influx-loadbalancer.conf
Grafana InfluxDB dashboard -------------------------
InfluxDB_Dashboard.json <influx_ha/InfluxDB_Dashboard.json>