6.2 KiB
Overview
The StackLight InfluxDB-Grafana Fuel Plugin is used to install and configure InfluxDB and Grafana which collectively provide access to the metrics analytics of Mirantis OpenStack. InfluxDB is a powerful distributed time-series database to store and search metrics time-series. The metrics analytics are used to visualize the time-series and the annotations produced by the StackLight Collector. The annotations contain insightful information about the faults and anomalies that resulted in a change of state for the clusters of nodes and services of the OpenStack environment.
The InfluxDB-Grafana Plugin is an indispensable tool to answering the questions "what has changed in my OpenStack environment, when and why?". Grafana is installed with a collection of predefined dashboards for each of the OpenStack services that are monitored. Among those dashboards, the Main Dashboard provides a single pane of glass overview of your OpenStack environment status.
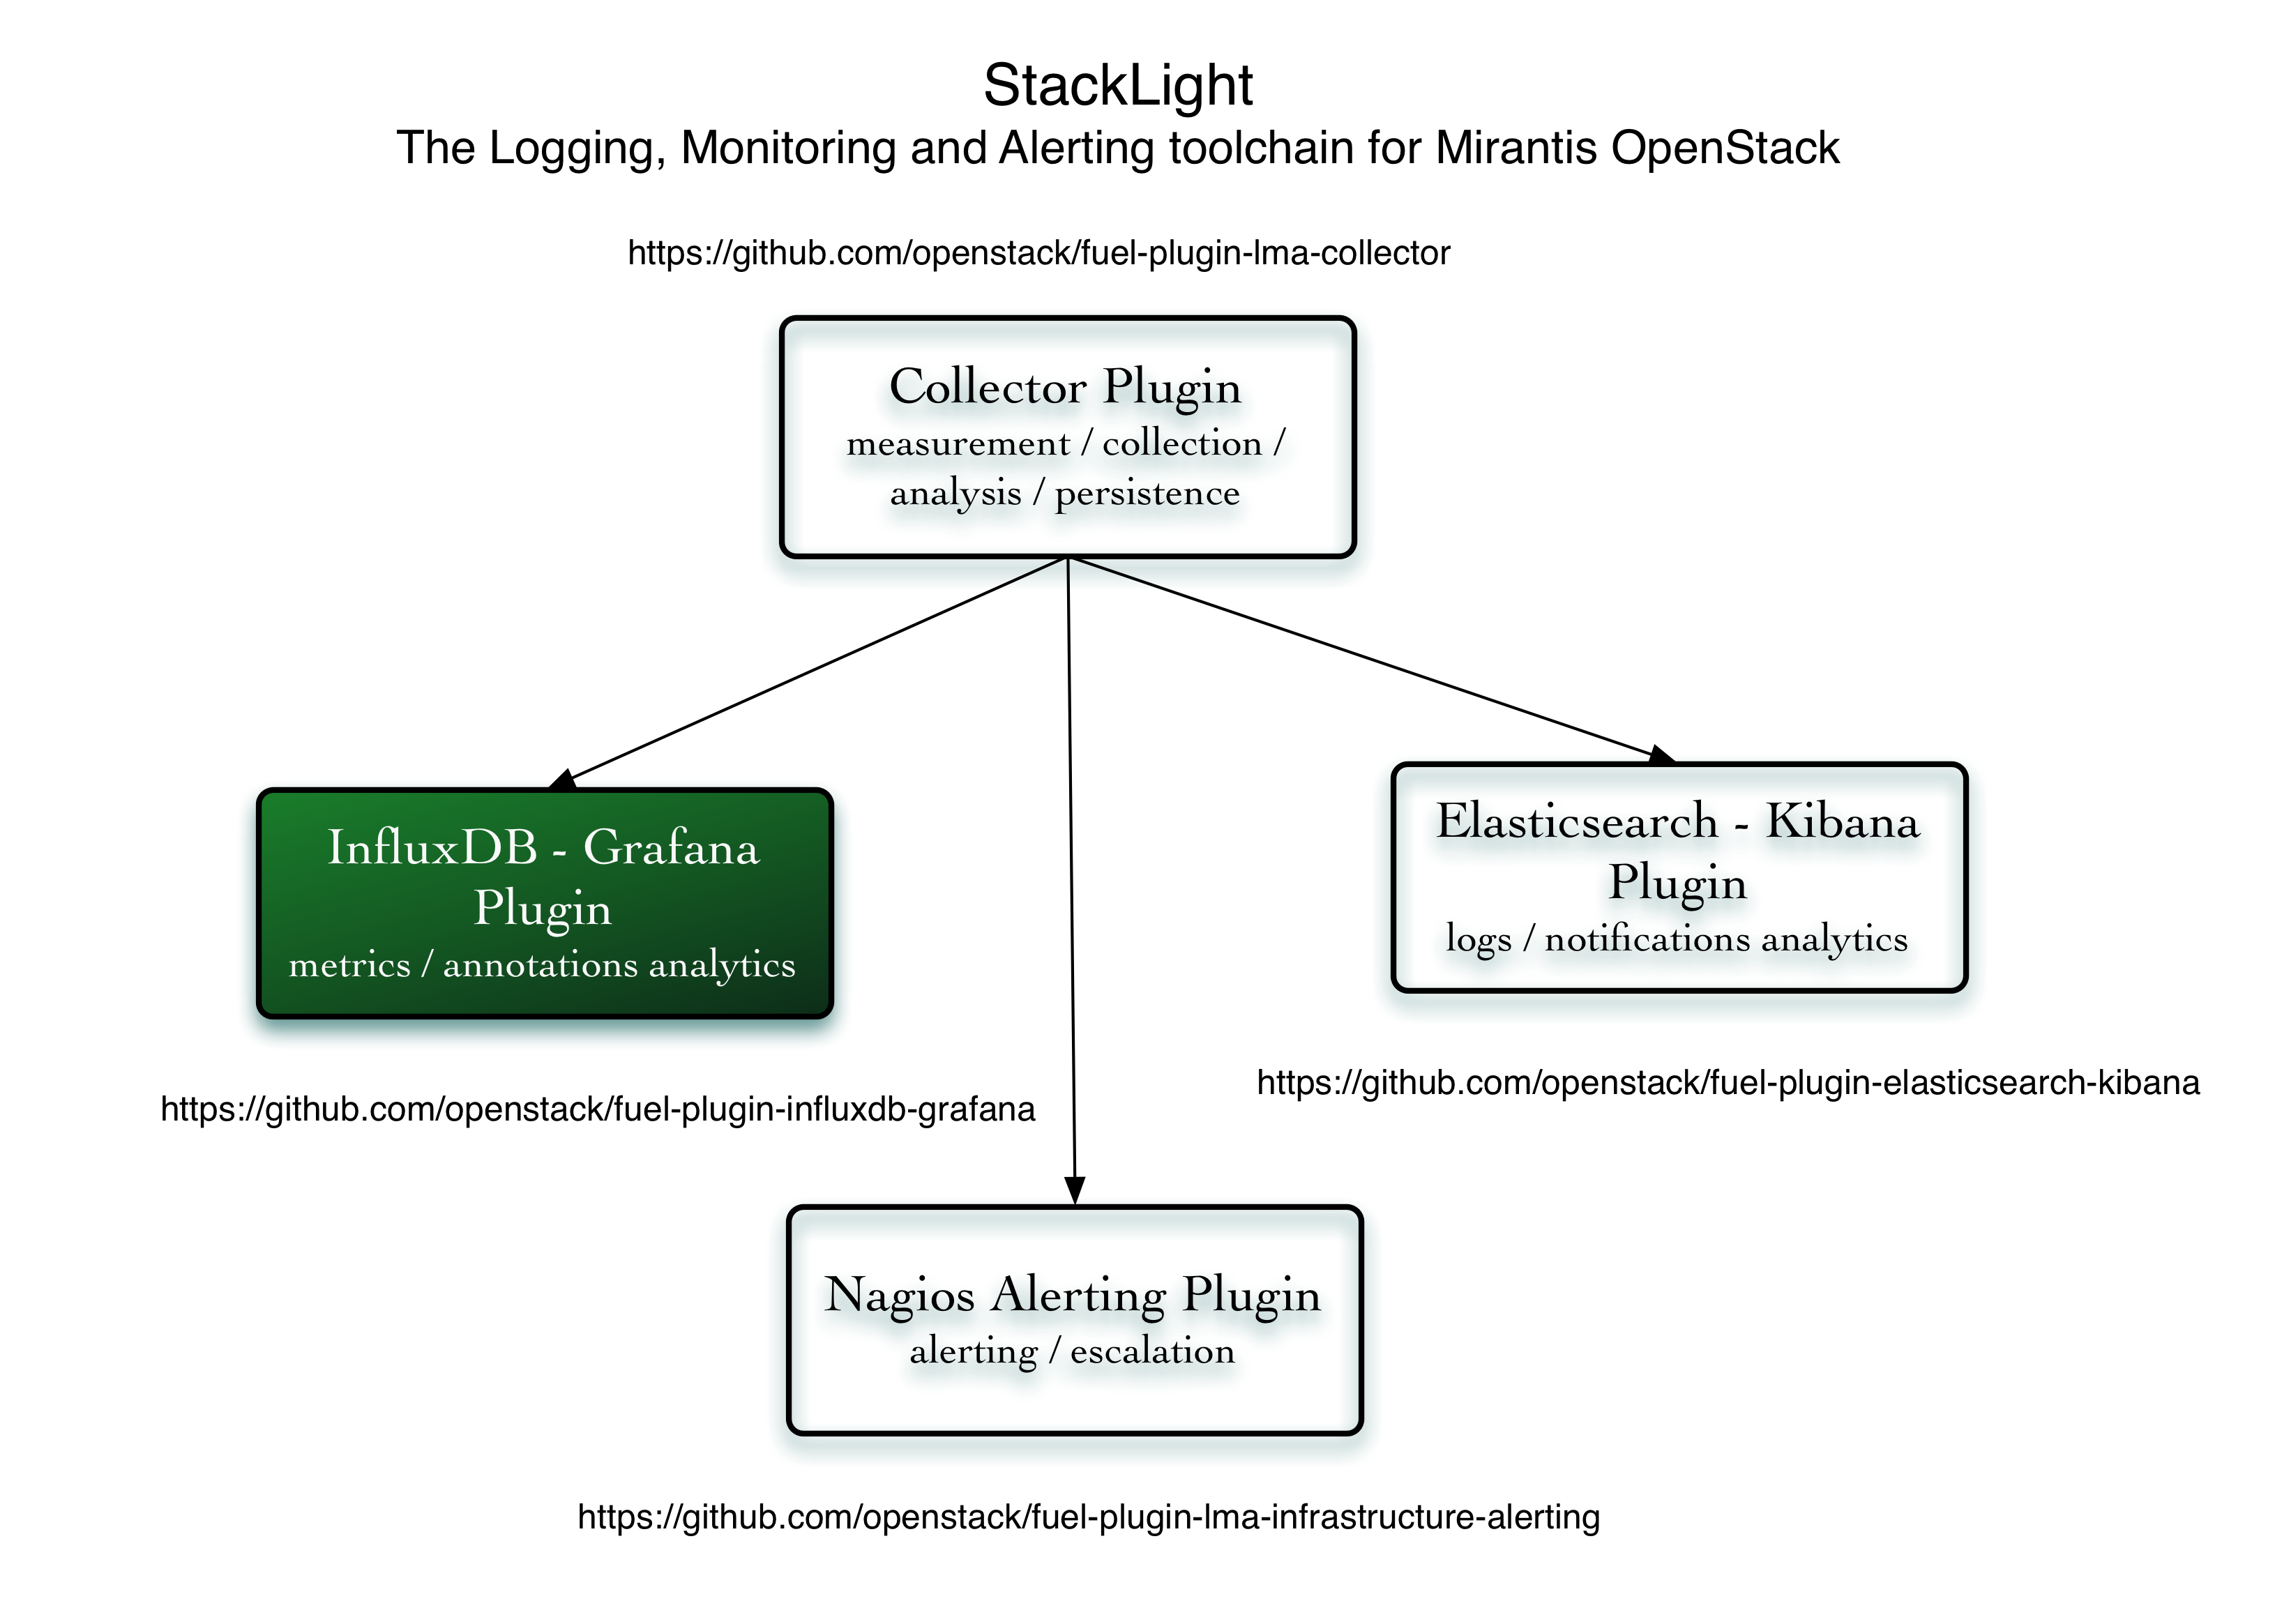
InfluxDB and Grafana are key components of the LMA Toolchain project as shown in the figure below.

Requirements
| Requirement | Version/Comment |
|---|---|
| Disk space | The plugin’s specification requires to provision at least 15GB of disk space for the system, 10GB for the logs and 30GB for the database. The installation of the plugin will fail if there is less than 55GB of disk space available on the node. |
| Mirantis OpenStack | 8.0, 9.0 |
| Hardware configuration | The hardware configuration (RAM, CPU, disk(s)) required by this plugin depends on the size of your cloud environment and other factors like the retention policy. An average setup would require a quad-core server with 8 GB of RAM and access to a 500-1000 IOPS disk. Please check the InfluxDB Hardware Sizing Guide for additional sizing information. It is also highly recommended to use a dedicated disk for your data storage. Otherwise, The InfluxDB-Grafana Plugin will use the root filesystem by default. |
Limitations
Currently, the size of an InfluxDB cluster the Fuel plugin can deploy is limited to three nodes. In addition to this, each node of the InfluxDB cluster is configured to run under the meta node role and the data node role. Therefore, it is not possible to separate the nodes participating in the Raft consensus cluster from the nodes accessing the data replicas.
Key terms, acronyms and abbreviations
| Terms & acronyms | Definition |
|---|---|
| The Collector | The StackLight Collector is a smart monitoring agent running on every node which collects and process the metrics of your OpenStack environment. |
| InfluxDB | InfluxDB is a time-series, metrics, and analytics open-source database (MIT license). It’s written in Go and has no external dependencies. InfluxDB is targeted at use cases for DevOps, metrics, sensor data, and real-time analytics. |
| Grafana | Grafana is an (Apache 2.0 Licensed) general purpose dashboard and graph composer. It's focused on providing rich ways to visualize metrics time-series, mainly though graphs but supports other ways to visualize data through a pluggable panel architecture. It currently has rich support for Graphite, InfluxDB and OpenTSDB and also supports other data sources via plugins. Grafana is most commonly used for infrastructure monitoring, application monitoring and metric analytics. |