4.1 KiB
InfluxDB-Grafana Plugin for Fuel
InfluxDB-Grafana plugin
Overview
InfluxDB provides an open source time series database. Grafana is a rich dashboard and graph editor for InfluxDB.
Requirements
| Requirement | Version/Comment |
|---|---|
| Mirantis OpenStack compatibility | 6.1 or higher |
Recommendations
None.
Limitations
None.
Installation Guide
InfluxDB-Grafana plugin installation
To install the InfluxDB-Grafana plugin, follow these steps:
-
Download the plugin from the Fuel Plugins Catalog.
-
Copy the plugin file to the Fuel Master node. Follow the Quick start guide if you don't have a running Fuel Master node yet.
scp influxdb_grafana-0.7-0.7.0-0.noarch.rpm root@<the Fuel Master node IP address>: -
Install the plugin using the
fuelcommand line:fuel plugins --install influxdb_grafana-0.7-0.7.0-0.noarch.rpm -
Verify that the plugin is installed correctly:
fuel plugins
Please refer to the Fuel Plugins wiki if you want to build the plugin by yourself, version 2.0.0 (or higher) of the Fuel Plugin Builder is required.
User Guide
InfluxDB-Grafana plugin configuration
- Create a new environment with the Fuel UI wizard.
- Add a node with the "Operating System" role.
- Before applying changes or once changes applied, edit the name of the node by clicking on "Untitled (xx:yy)" and modify it for "influxdb".
- Click on the Settings tab of the Fuel web UI.
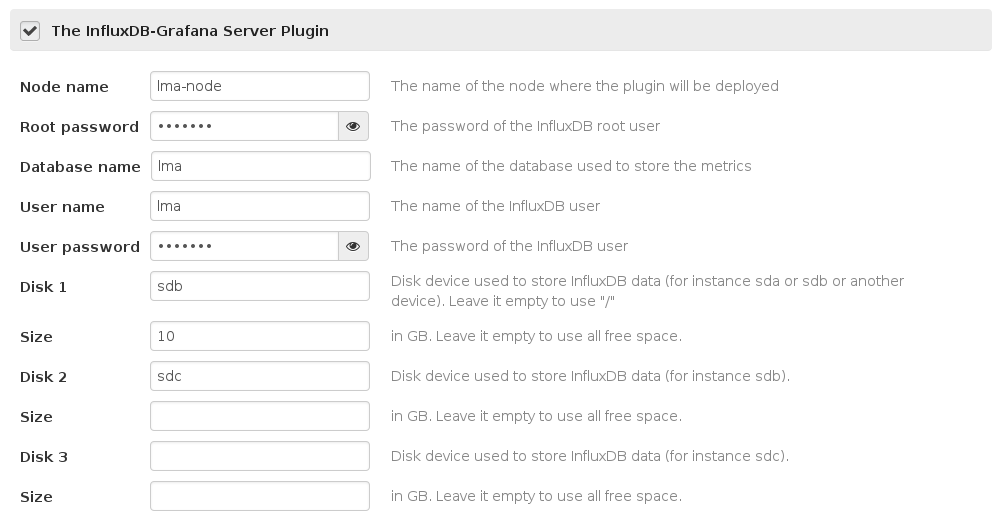
- Scroll down the page, select the "InfluxDB-Grafana Server plugin" checkbox
and fill-in the required fields.
- The name of the node where the plugin is deployed.
- The password for the root user.
- The name of the database where you want to store your metrics.
- The username and the password for this specific database.
You can select up to 3 physical disks that will be mounted as a single logical volume to store the InfluxDB data. If you specify no disk, the data will be stored on the root filesystem. In all cases, InfluxDB data will be located in the /opt/influxdb directory.
For each disk, you can also specify the allocated size (in GB). If you don't specify a value, the plugin will use all the free space of the disk.
Here is a screenshot of the fields
Testing
InfluxDB
Once installed, you can check that InfluxDB is working using curl:
curl -G 'http://<HOST>:8086/db/lma/series?u=lma&p=<yourpassword>' --data-urlencode "q=list series"
Where HOST is the IP address or the name of the node that runs the server and
yourpassword is the password provided in the Fuel UI for the user of InfluxDB.
The curl command should return a valid JSON object similar to:
[{"name":"list_series_result","columns":["time","sequence_number","name"],"points":[...]}]
Grafana
To check that Grafana is running, you need to make sure that nginx is listening on port 80. The user interface is available at:
http://$HOST/
Note: if you deploy this plugin on a node that is also running the Elasticsearch-Kibana plugin then nginx will use the port 8000 instead of 80. So in that case the user interface is available at:
http://$HOST:8000/
Known issues
None.
Release Notes
0.7.0
- Initial release of the plugin. This is a beta version.
Contributors
- Guillaume Thouvenin gthouvenin@mirantis.com
- Simon Pasquier spasquier@mirantis.com
- Swann Croiset scroiset@mirantis.com
